Google Analytics tells you what happened. Session replay tells you why. If you only have one of the two, you are missing half the picture of how people actually use your site, and that gap is usually where lost revenue hides.
Most teams start with Google Analytics because it is free, familiar, and gives you numbers to report in a meeting. Pageviews are up. Bounce rate is down. Conversion rate moved half a point. These are useful facts, but they are aggregates. They tell you that something changed, not what a real visitor experienced when they clicked away from your pricing page or gave up halfway through checkout. That is the job session replay does instead, and the two tools solve different problems well enough that most growing sites end up needing both.
What Google Analytics Is Actually Good At
GA4 excels at scale and trend. It can tell you that organic traffic from a specific landing page converts at 2.1 percent while paid traffic from the same page converts at 0.8 percent. It can show you a 90 day trend line and flag that mobile conversion dropped sharply after a release. It is built for pattern detection across thousands or millions of sessions, and for that job nothing beats it.
Where it runs out of road is explanation. GA4 can tell you the checkout page has a 40 percent drop off rate, but it cannot show you the visitor who typed their card number three times because the field kept rejecting spaces. It cannot show you the confused scroll pattern on a pricing table that looks fine on desktop but breaks on a specific phone width. Numbers describe outcomes. They do not describe behavior.
What Session Replay Adds
Session replay records how real visitors move through your site: where they click, where they hesitate, where the cursor circles back and forth like someone hunting for a button that should be obvious. Watch a handful of replays on a page with a known drop off and patterns appear fast. A form field with the wrong autofill type. A call to action buried below a slow loading image. A modal that pops up and covers the exact spot someone was about to click.
This is qualitative evidence, not a replacement for the quantitative view GA4 gives you. It answers the question your dashboard cannot: not just that visitors left, but what they were doing in the seconds before they left. Pair that with a heatmap of the same page and you get a second layer, showing at a glance where attention clusters and where it never reaches at all.
The dashboard tells you a page is broken. The recording tells you exactly where, and for whom.
Where the Two Tools Overlap, and Where They Don't
Some teams assume session replay is just a fancier version of analytics, or that analytics alone is enough once you have enough historical data. Neither is quite right. GA4 is built around events and conversions you define ahead of time. If you didn't think to track a particular click, it isn't in your reports. Session replay captures everything that happened on screen, including the things you never thought to instrument, which is exactly why it catches problems analytics configuration misses entirely.
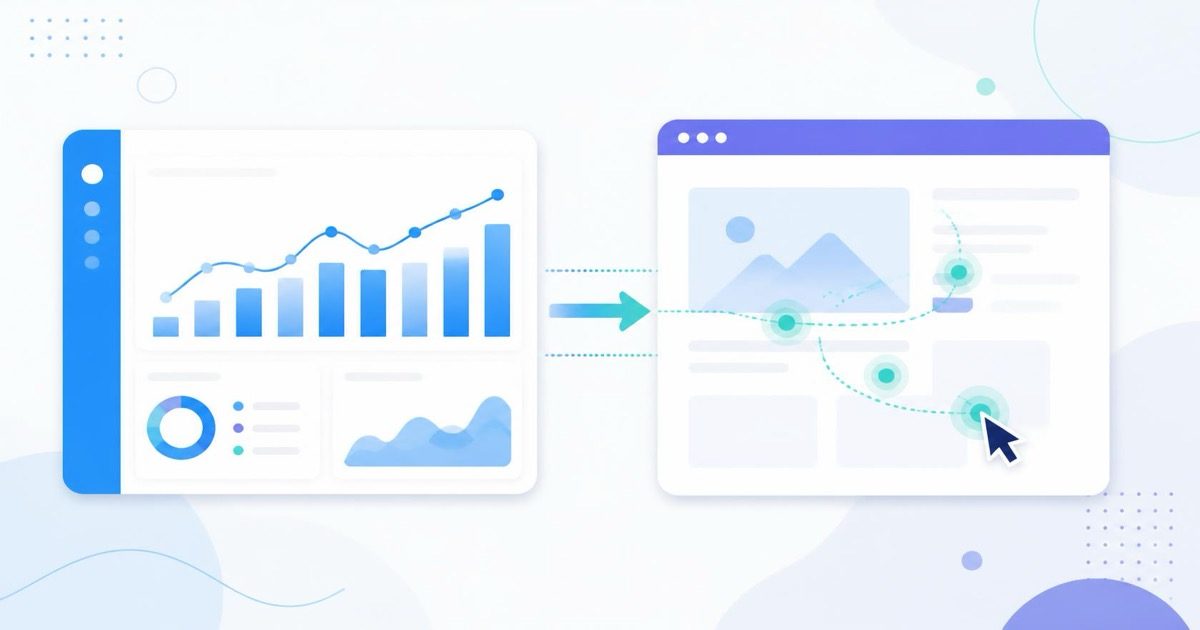
The overlap is in funnels. Both tools can show you a checkout funnel with a drop off at step two. The difference is what you do next. In GA4 you can segment that drop off by device or traffic source. In a replay tool you can actually watch five sessions from that segment and see the shared failure point in under ten minutes. Used together, the segmentation narrows down who to watch, and the recordings tell you why they left.
A Practical Way to Combine Them
- Use GA4 (or any traffic analytics tool you already run) to spot the page or step with an unusual drop off rate compared to its historical baseline.
- Filter session replay by that specific page, device type, and date range so you are watching relevant sessions, not a random sample.
- Watch five to ten recordings in a row rather than one. A single session can be an outlier; a pattern across several is a real problem.
- Check the matching heatmap for that page to confirm what you saw in individual recordings holds true at scale.
- Fix the smallest, most repeated friction point first, then re-check the funnel numbers a week later to confirm the fix actually moved the needle.
This loop, aggregate data pointing you to a problem area and recordings showing you the actual cause, is faster than either tool used alone. It also keeps you from guessing. Redesigning a page based on a hunch is expensive. Redesigning it after watching real visitors get stuck on one specific element is a much safer bet.
Why Most Teams Delay Adding Session Replay
The usual reasons are page speed, privacy concerns, and setup complexity. All three are fair concerns, and they are also solvable. A replay script that adds hundreds of kilobytes and a noticeable delay to page load will hurt the exact conversion rate you are trying to improve, which defeats the purpose. Privacy matters more every year, and a tool that records every keystroke and payment field without masking sensitive inputs is a real compliance risk, not just an inconvenience.
This is the gap LeadFnF was built to close. It runs from a single script under 3KB, so it does not compete with your page for load time the way older, heavier replay tools do. Session recordings, heatmaps, and funnel views all sit in the same real-time dashboard, and sensitive fields are handled with privacy-first defaults out of the box rather than as an afterthought you have to configure yourself. You see the same real, unedited behavior that a heavier tool captures, without the tradeoffs that make teams put replay off for another quarter.
Reading Both Views Together
Neither tool replaces the other, and that is the actual point. Google Analytics is your early warning system, built for scale and trend detection across your whole audience. Session replay and heatmaps are your investigation tool, built to show you specific, individual reasons why the numbers moved. Teams that rely on only one end up either drowning in data with no clear next action, or fixing individual anecdotes that never move the aggregate metrics at all.
Start small if you have not combined the two before. Pick your worst performing page this month, pull the funnel data you already have, then watch ten real sessions on that exact page. You will likely see the cause of the drop off within the first few recordings, something a dashboard alone was never going to show you.
If you want to see how session replay, heatmaps, and funnels look together in one lightweight dashboard, try LeadFnF free and watch your own visitors instead of guessing what they did.