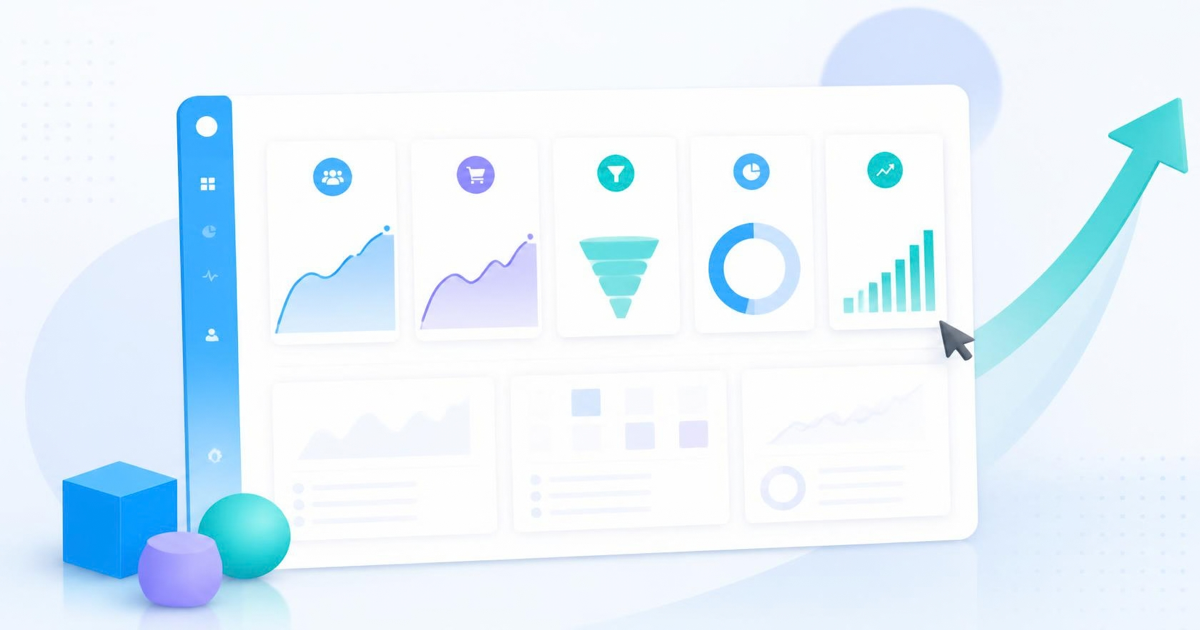

Most dashboards are full of numbers that feel important but don't actually predict anything. Pageviews go up. Sessions go up. Average time on page looks healthy. And conversions stay exactly where they were last month. If you've ever stared at a traffic report and wondered why none of it explains your revenue, the problem isn't your traffic. It's your metrics.
Out of the dozens of numbers most analytics tools surface, only a handful actually correlate with whether a visitor is going to buy. The rest are vanity signals: easy to screenshot, hard to act on. Here are the five that genuinely predict purchase intent, and how to watch them without drowning in dashboards.
1. Scroll depth on your pricing and product pages
How far someone scrolls tells you whether they're actually reading or just glancing and leaving. A visitor who scrolls past the fold on a pricing page is doing real evaluation work: comparing tiers, checking what's included, looking for the catch. A visitor who bounces after two seconds without scrolling never engaged with your offer at all, no matter what the "time on page" metric claims.
The useful version of this metric isn't average scroll depth across your whole site. It's scroll depth segmented by page type. A blog post with 40% average scroll depth is fine. A pricing page with 40% average scroll depth means most visitors never see your full tier comparison or your FAQ section, and that's a page you need to fix before you spend another dollar on traffic.
2. Rage clicks and dead clicks
A rage click is when someone clicks the same spot repeatedly in frustration, usually because something looks clickable but isn't, or because a form field silently failed to register input. A dead click is a single click on something that does nothing. Both are near-perfect predictors of abandonment, because they capture the exact moment confusion turns into exit.
These events matter more than raw click counts because they isolate friction instead of just activity. A page with lots of clicks could mean high engagement or it could mean visitors are stuck trying to find something that should have been obvious. Session replay is the fastest way to tell the difference: watch a handful of rage-click sessions and you'll usually spot the broken element within minutes.
A visitor who clicks the same button three times in frustration isn't engaged. They're one click away from leaving your site entirely.
3. Funnel drop-off at the step just before payment
Overall conversion rate is a lagging indicator. It tells you the final score without telling you where the game was lost. The step immediately before checkout or signup, whether that's a shipping form, a plan selection screen, or an account creation step, is where most of your buying intent quietly evaporates.
Track this step specifically rather than relying on a single funnel-wide percentage. If 70% of visitors reach your pricing page but only 15% make it past the payment details form, you don't have a traffic problem or even a pricing problem. You have a friction problem on one specific screen, and that's fixable in an afternoon once you know exactly where to look.
4. Returning visitor behavior in the 48 hours before purchase
First-time visitors rarely buy on the first session, especially for anything above a low price point. The stronger signal is what a returning visitor does in the day or two before they convert: which pages they revisit, whether they go straight back to pricing, whether they open your FAQ or your comparison page again.
This pattern shows up clearly in session data once you start looking at visitor history rather than single sessions in isolation. A visitor who checked your pricing page three times over two days and then signed up on the fourth visit gave you a clear signal each time. Most analytics setups never connect those sessions together, which means that signal gets lost entirely.
5. Time to first meaningful interaction, not time on page
Time on page is one of the most misleading metrics in analytics because it rewards confusion as much as engagement. Someone who spends three minutes on a page because they're lost looks identical, in a standard report, to someone who spends three minutes because they're genuinely interested.
Time to first meaningful interaction, meaning the first scroll, click, or form field focus, separates the two. A fast first interaction suggests a visitor who knew what they wanted and found it quickly. A long delay before any interaction at all often means the page took too long to load, or the layout didn't make the next step obvious. Either way, it's a far better early warning than raw dwell time.
Watching these metrics without a heavier stack
None of these five metrics require a complex analytics setup. What they do require is a tool that captures behavior, not just pageviews: scroll depth, click events, funnel steps, and returning visitor history, ideally tied to session replay so you can watch the actual moment things went wrong instead of guessing from a chart.
This is the gap LeadFnF was built to close. It runs as a single, privacy-first script under 3KB, and it gives you session replay, heatmaps, funnels, and real-time visitor behavior in one place, without the cookie-consent overhead of heavier platforms. You don't need five separate tools to track five metrics. You need one that was built to show you the moments that actually matter.
If you've been staring at a traffic report that doesn't explain your conversion rate, the fix usually isn't more data. It's watching the right five numbers instead of the usual dozen. Start a free LeadFnF trial and see which of these five is quietly costing you customers.