
Open Google Analytics 4 for the first time and you are greeted with a dashboard built for data analysts, not for someone who just wants to know if their website is working. Engagement rate, engaged sessions, event count, key events, exploration reports. None of it answers the question you actually came to ask: are visitors doing what I want them to do, and if not, why?
GA4 is not badly built. It is built for a different job than most small business owners and marketers need done. Here is a simpler way to look at the same questions, without needing a certification to read your own numbers.
The question GA4 makes hard: is my site working right now
GA4's real-time report exists, but it is buried a few clicks deep and shows raw counts with little context. Most people want a much simpler answer: how many people are on my site right now, what are they looking at, and where did they come from. That should be the first thing you see, not something you have to go hunting for.
A live visitor count with top pages and top sources, visible the moment you open your dashboard, answers that question in about two seconds. No custom exploration report required.
The question GA4 cannot answer at all: why
This is the real gap. GA4 can tell you that a page has a 70 percent exit rate. It cannot tell you that visitors are exiting because a form field throws a confusing error, or because a button that looks clickable does not respond, or because the price only appears after three clicks. Numbers describe the symptom. They never show you the cause.
A chart can tell you people left. It cannot show you the moment they decided to.
Session replay closes that gap directly. It records real visits like a short video: every scroll, click, and hesitation. Watch a handful of recordings from a page with a high exit rate and the pattern usually becomes obvious within minutes, something GA4's numbers alone could never reveal.
The question GA4 makes you build reports to answer: where do people actually click
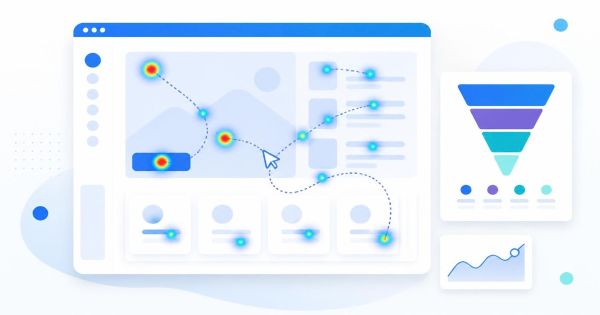
Wanting to know which parts of a page get attention should not require setting up custom events for every button and link. A click heatmap shows this automatically, layering every visitor's clicks into one image so you can see at a glance which calls to action get noticed and which ones sit ignored.
Simplifying the metrics that matter
Most of what GA4 tracks by default is not something a small business needs to act on daily. A shorter, more useful list looks like this:
- Visitors right now, and where they are on your site
- Which pages people land on, and which ones they leave from
- Whether visitors are completing the goal you actually care about, a purchase, a signup, a booking
- Where in that journey people are dropping off, and a way to see why
Everything else is detail you can dig into later if a specific question calls for it, not something you need on the front screen of your dashboard every day.
You do not have to choose complexity to get accuracy
The common assumption is that simple dashboards must be sacrificing depth. In practice, the opposite is often true. GA4's sampling and modeled data mean the numbers you see are frequently estimates, not exact counts, especially on lower traffic sites. A tool built around real-time, unsampled data, session replay, and heatmaps gives you fewer numbers to stare at and more direct evidence of what is actually happening.
Bringing it together
GA4 is a capable tool, but capability and clarity are not the same thing. If you are opening your analytics and coming away with more questions than answers, the problem is not you. It is a dashboard designed for a workflow most people do not have.
LeadFnF was built around the questions people actually ask: who is here right now, where do they click, and why do they leave. Real-time analytics, session replay, funnels, and heatmaps from one lightweight script, with nothing to configure before it makes sense. Start a free 14 day trial and see your own site's numbers explained instead of just reported.