Wix gives every site a built-in analytics dashboard the moment you publish, and for a lot of small business owners that feels like enough. You can see visitor counts, top traffic sources, and sales numbers if you run a Wix store. What you can't see is why people leave, where they get stuck, or what they actually do before they click away. That gap is where real conversion problems hide.
What Wix Gives You Out of the Box
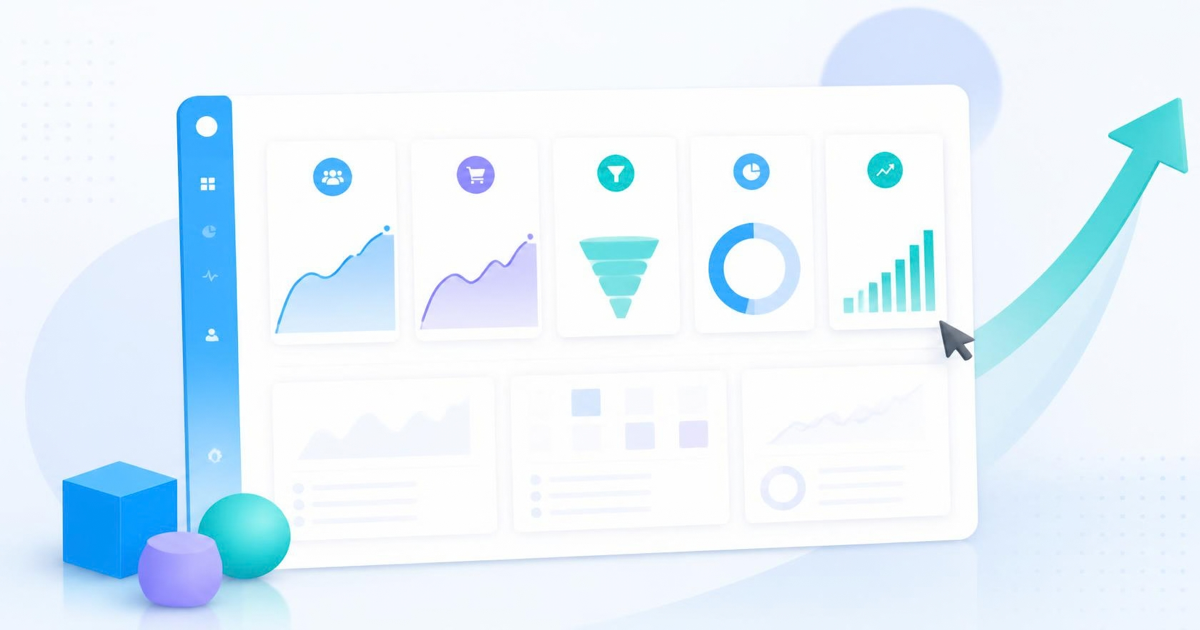
Wix Analytics, available on most paid plans, covers the basics reasonably well. You get a traffic overview (sessions, unique visitors, page views), a breakdown of where visitors came from (search, social, direct, referral), and if you're running Wix Stores, sales reports tied to specific products and campaigns. There's also a built-in SEO panel that flags obvious issues like missing meta descriptions or broken links.
For a brand-new site with low traffic, this is genuinely useful. You can confirm that your marketing is sending people somewhere, and you can see which channel is working. It answers "is anyone showing up" reasonably well.
Where Wix's Built-In Analytics Falls Short
The problem starts once you want to know what happens after someone lands on a page. Wix's dashboard tells you a visitor spent 40 seconds on your pricing page, but not whether they read it carefully, scrolled past it in three seconds, or got stuck trying to click a button that didn't respond. It tells you 60% of people left your checkout, but not which field made them give up.
That's not a flaw unique to Wix. Most built-in platform analytics (Shopify's basic dashboard, Squarespace's visitor stats) share the same limitation: they count things well and explain almost nothing. Counting is useful for reporting. It's not useful for fixing a page that isn't converting.
Why Traffic Numbers Don't Explain Behavior
Here's a concrete example. Say your Wix store gets 2,000 visitors a month and your dashboard shows a 1.8% conversion rate. That number alone doesn't tell you anything actionable. Is the problem the product photos? The shipping cost shown too late? A form field that resets when someone taps back? A button that looks clickable but isn't?
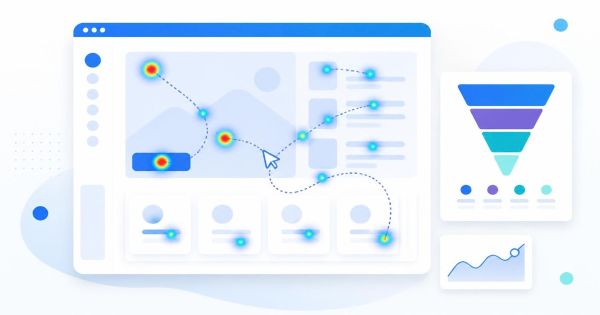
You can guess, or you can watch. Session replay tools record actual visitor sessions (mouse movement, taps, scrolls, form interactions) so you can see the exact moment someone hesitates or gives up. Heatmaps aggregate hundreds of those sessions into a single visual: where people click, how far they scroll, which elements get ignored entirely.
A traffic number tells you something happened. A session recording tells you what actually went wrong.
Adding Session Replay and Heatmaps to Wix
Wix makes it straightforward to add a third-party tracking script through its Custom Code panel in the site dashboard, no developer required. You paste in one script tag, set it to load on all pages, and it runs alongside Wix's own analytics without conflicting with it.
This is where a tool like LeadFnF fits in. It's a single, lightweight script (around 3KB) that adds session replay, heatmaps, and real-time visitor tracking on top of whatever Wix already gives you. You keep Wix Analytics for the traffic overview and layer behavioral data on top for the "why" that's currently missing. It's built privacy-first too, which matters if you're already being careful about consent banners and data retention on a Wix site.
What to Actually Watch For
Once you have replay and heatmaps running, don't try to watch everything. Start with your highest-traffic, highest-intent pages: checkout, your main product or service page, and your contact or signup form. Watch ten to fifteen sessions from each. You're looking for patterns, not a single weird visitor: repeated rage clicks on a non-working element, visitors scrolling past your call to action without pausing, or everyone abandoning a form at the same field.
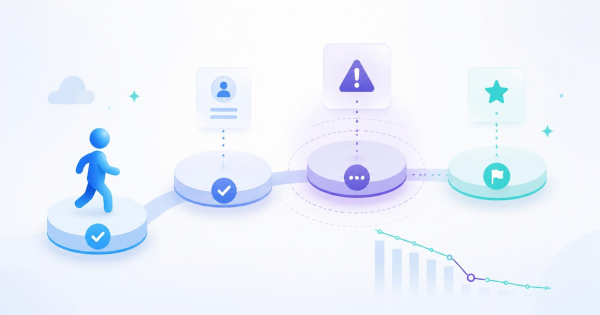
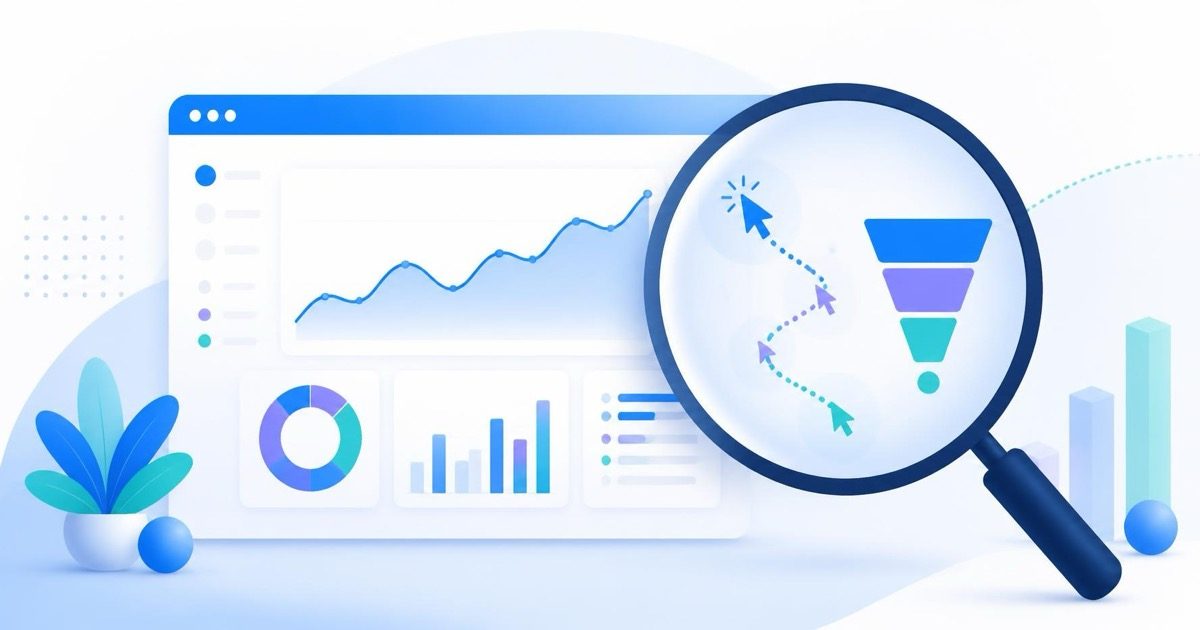
A funnel view helps here too. If you can see that 100 people reach your cart but only 40 reach checkout, and only 15 of those finish, you know exactly where to focus. Fixing the step with the biggest drop almost always matters more than polishing a page that's already converting fine.
A Simple Routine That Doesn't Slow Your Site
You don't need to live in a dashboard every day. A short weekly check works well for most small Wix sites: look at the week's traffic numbers in Wix Analytics first, then spend ten minutes in your replay tool watching sessions from your worst-performing page. Note one thing to fix. Fix it. Check again next week.
This routine matters more than the tool itself. Plenty of site owners install a tracking script, watch a handful of recordings once, and never open the dashboard again. The value comes from making it a habit, even a small one, rather than a one-time audit.
Putting It Together
Wix's built-in analytics is a fine starting point and there's no reason to turn it off. It's just not built to explain visitor behavior, and for a small business trying to improve conversions, behavior is the part that actually moves revenue. Adding a lightweight layer of session replay and heatmaps closes that gap without slowing down your site or requiring a developer.
If you're running a Wix site and want to see what your visitors are actually doing, not just how many of them showed up, try LeadFnF free for 14 days. No credit card, and you'll have your first session recordings within minutes of adding the script.